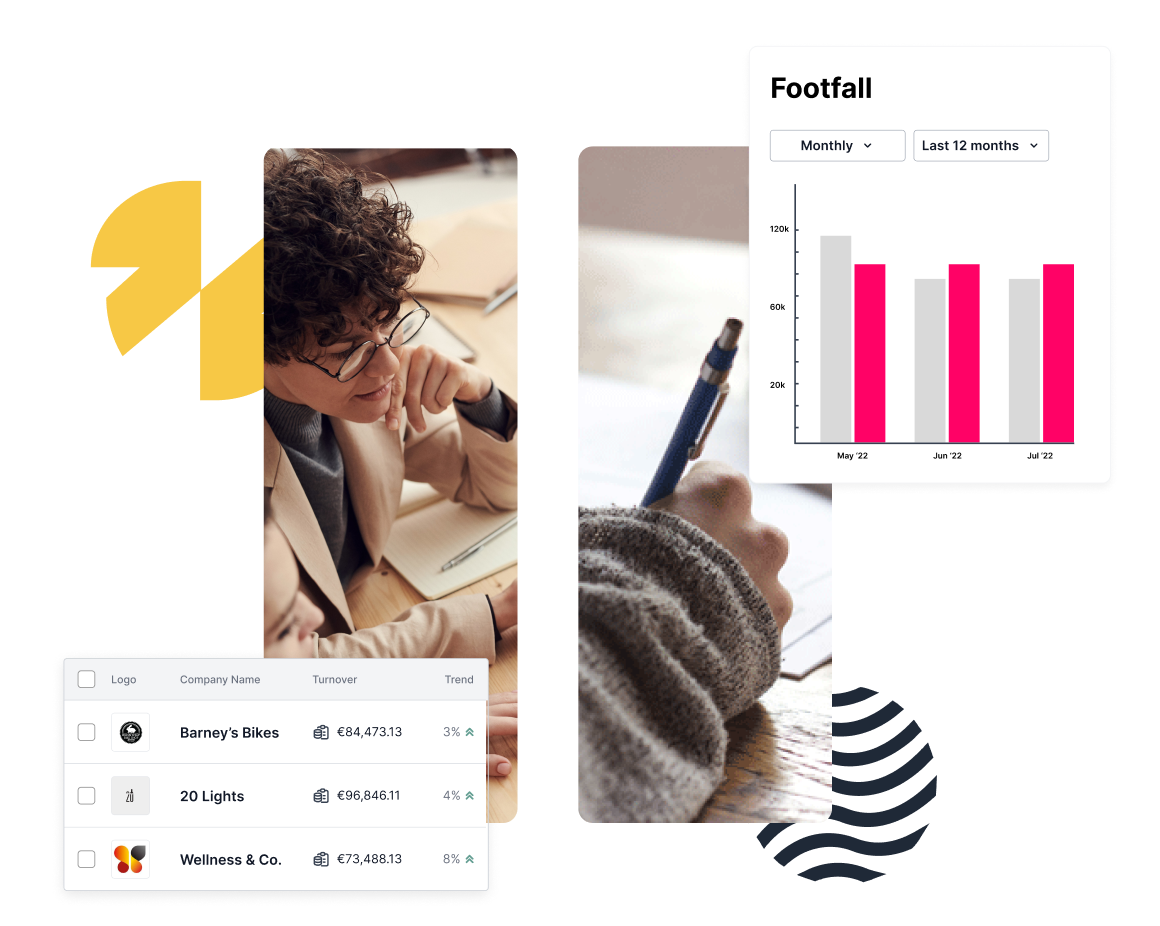
Monitor all of your portfolio's Data & Analytics via one dashboard
Oversee and analyse the results collected from your diverse data service providers in the Chainels platform. Whether it's data related to your tenant's engagement with content, satisfaction and messages or your building's indoor air quality, footfall, and turnover data, you can consolidate this information to optimise your organisation's decision-making processes.
Global organisations turning their data sets into decision sets
"Multi Corporation aims to gain relevant data insights from visitors and Chainels plays a role in making sure that the right data is accessible to the right person that can act upon these insights."
Steven Poelman, co-CEO at Multi Corporation
MANAGE EASIER
Connect and manage your building's technologies for portfolio optimisation
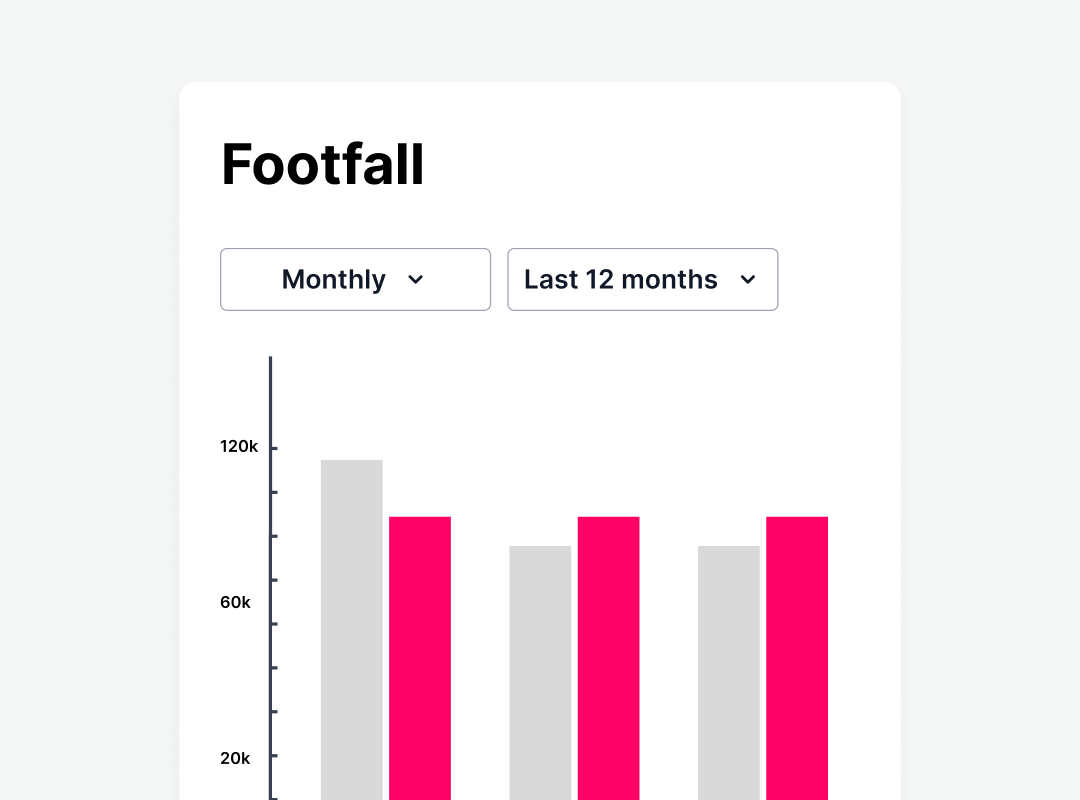
Gather and combine data related to your portfolio including store performance, footfall insight, data regarding the customer profile, spending patterns and ESG.
Integrate all of your building's hardware – such as footfall and IAQ sensors – into the Chainels platform to enable comparisons and reveal portfolio trends.
Easily manage your portfolio's metrics such as NPS, energy usage, issue resolution times and occupancy of bookable items.
STAY UP-TO-DATE
One overview keeps your finger on the pulse
The management tab is your portfolio's central hub to track diverse data – in detail – such as energy usage and issue resolution times, all in a single overview.
Oversee the general trends of your tenants' performance, number of visitors who frequent your properties as well as how they chose to spend their money.
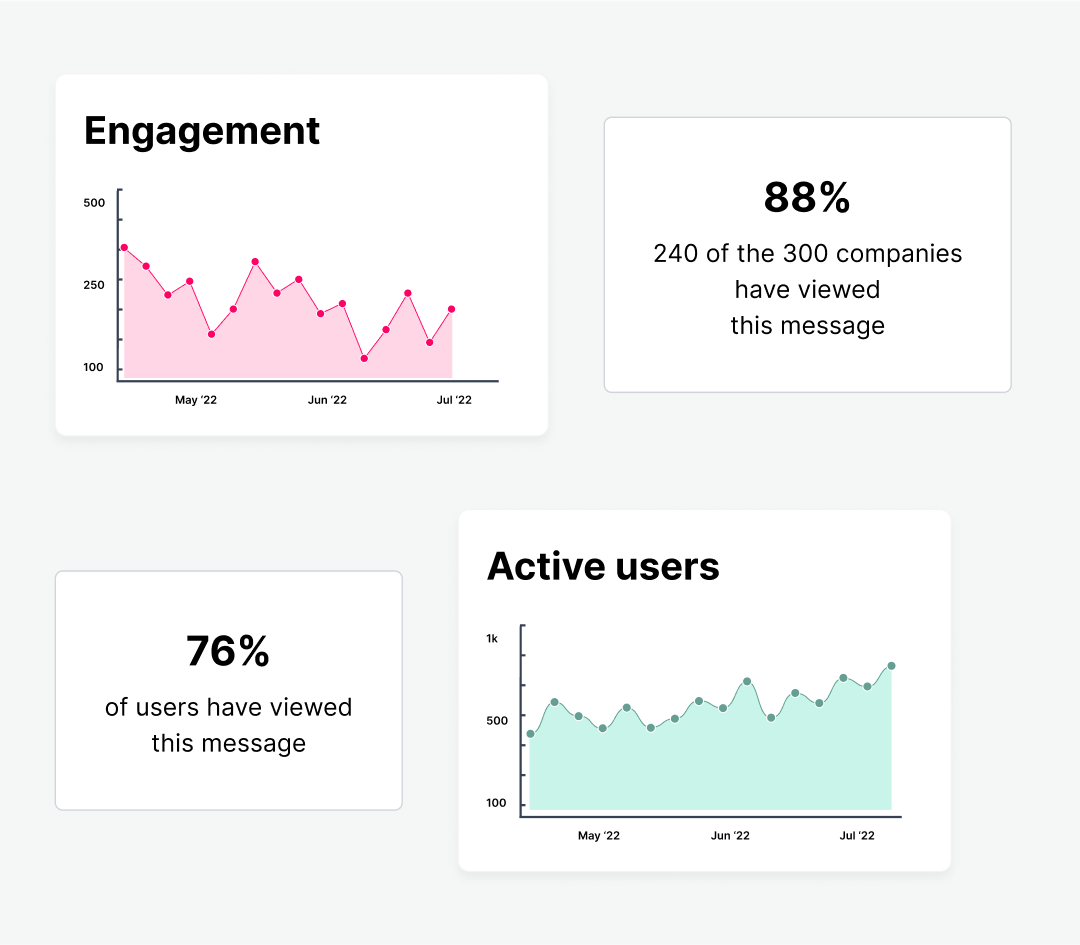
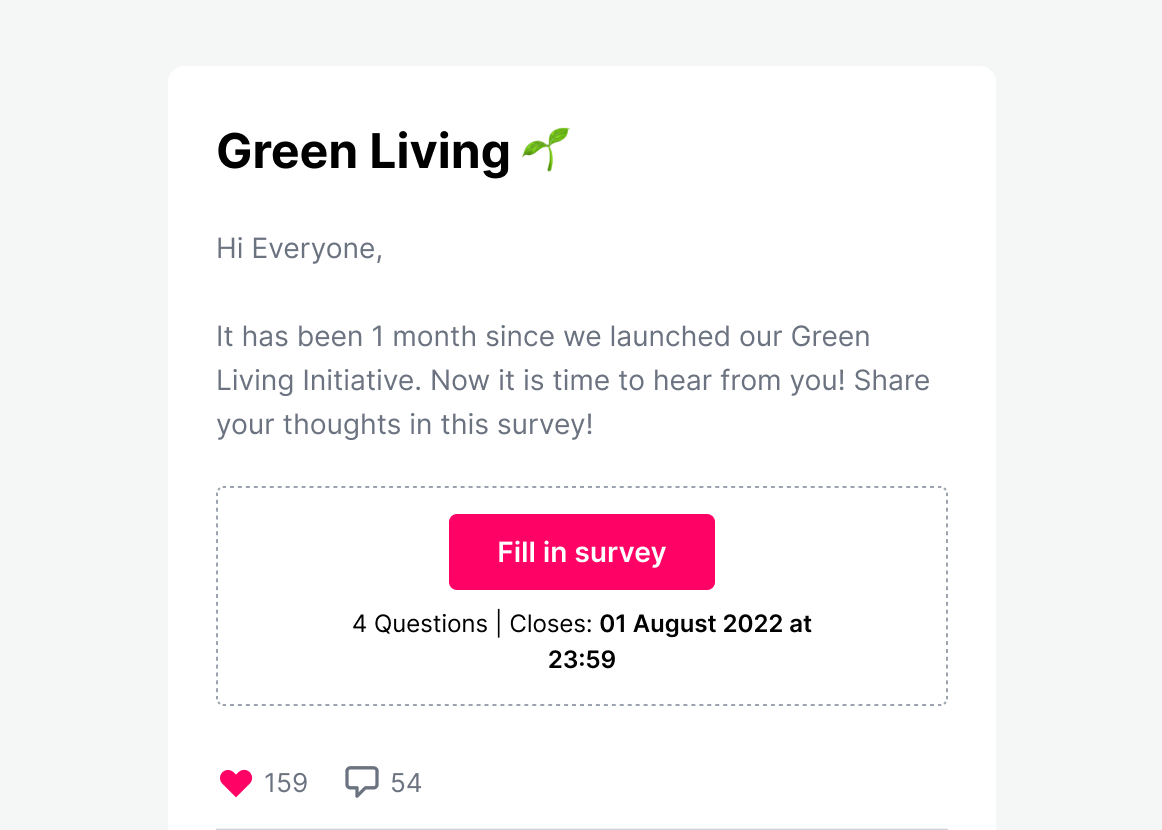
A property's management has a broad perspective of the entire portfolio's tenant activation as well as engagement statistics for messages, surveys and events.
DATA WORKS HARDER
Make cents of your portfolio's statistics
Find interrelationships between tenant survey responses, footfall insights and turnover reports as well as consumer payment patterns or a property's catchment area.
Analyse your tenant data with categorisations and user roles as well as integrate your data warehouse or BI tool for deeper analysis.
Turn collected numbers into decisions which bring value to your portfolio, such as tailoring your portfolio's tenant mix to the consumers visiting your properties or relocating tenants within your building or the service of service providers based on response times, resolution times and satisfaction ratings.
Integrate consumer behavioural data into decision-making processes, as well as feeding that data back to the tenants so they can improve their product offering.