Modern real estate operators have a problem.
They have invested heavily in smart meters, sensors, sub meters and gateways throughout their buildings. They have partnered with ESG and utility data providers to capture data across electricity, water, heat and gas. They collect, aggregate and analyse all of this information so they can reduce operational costs, work towards sustainability targets and report to investors.
Yet the data rarely reaches the one group of people who influence those numbers every single day. The tenants.
When data stays in dashboards, spreadsheets and management reports, its value is limited. The bottom line is that the utilities data you are collecting and analysing does not truly mean anything until it can be used to influence behaviour and achieve a clear goal, such as lowering energy usage, cutting operational costs or supporting ESG commitments. For that to become reality, your tenants need to be involved, informed and able to see their own impact.
Utilities Insights in Chainels is designed to bridge the gap between the data that exists in complicated dashboards and the tenants living and working in your buildings.
Why utilities insights saves your teams time
For many property teams, one of the most time consuming parts of working with utilities data is turning those readings into something useful and understandable for tenants.
Raw kWh values, indices, benchmark percentages and CO₂e figures are not intuitive. Someone has to interpret what they mean, create visually appealing graphs, and then communicate it across emails, whatsapp and other channels.
Utilities Insights in Chainels automates a large part of this translation step. Through integrations via API with your chosen provider, Utilities Insights pulls in the readings for electricity, gas, water and other relevant metrics, then transforms these complex dashboards into clear, contextual insights inside the platform. Readings update throughout the day and are refreshed nightly, so your tenants always see the most current data. The result is that your teams spend less time explaining the data and more time using that data to drive tangible outcomes in your communities.
![[BLOG Chainels] integrations](https://getchainels.com/hs-fs/hubfs/%5BBLOG%20Chainels%5D%20integrations.png?width=7680&height=4320&name=%5BBLOG%20Chainels%5D%20integrations.png)
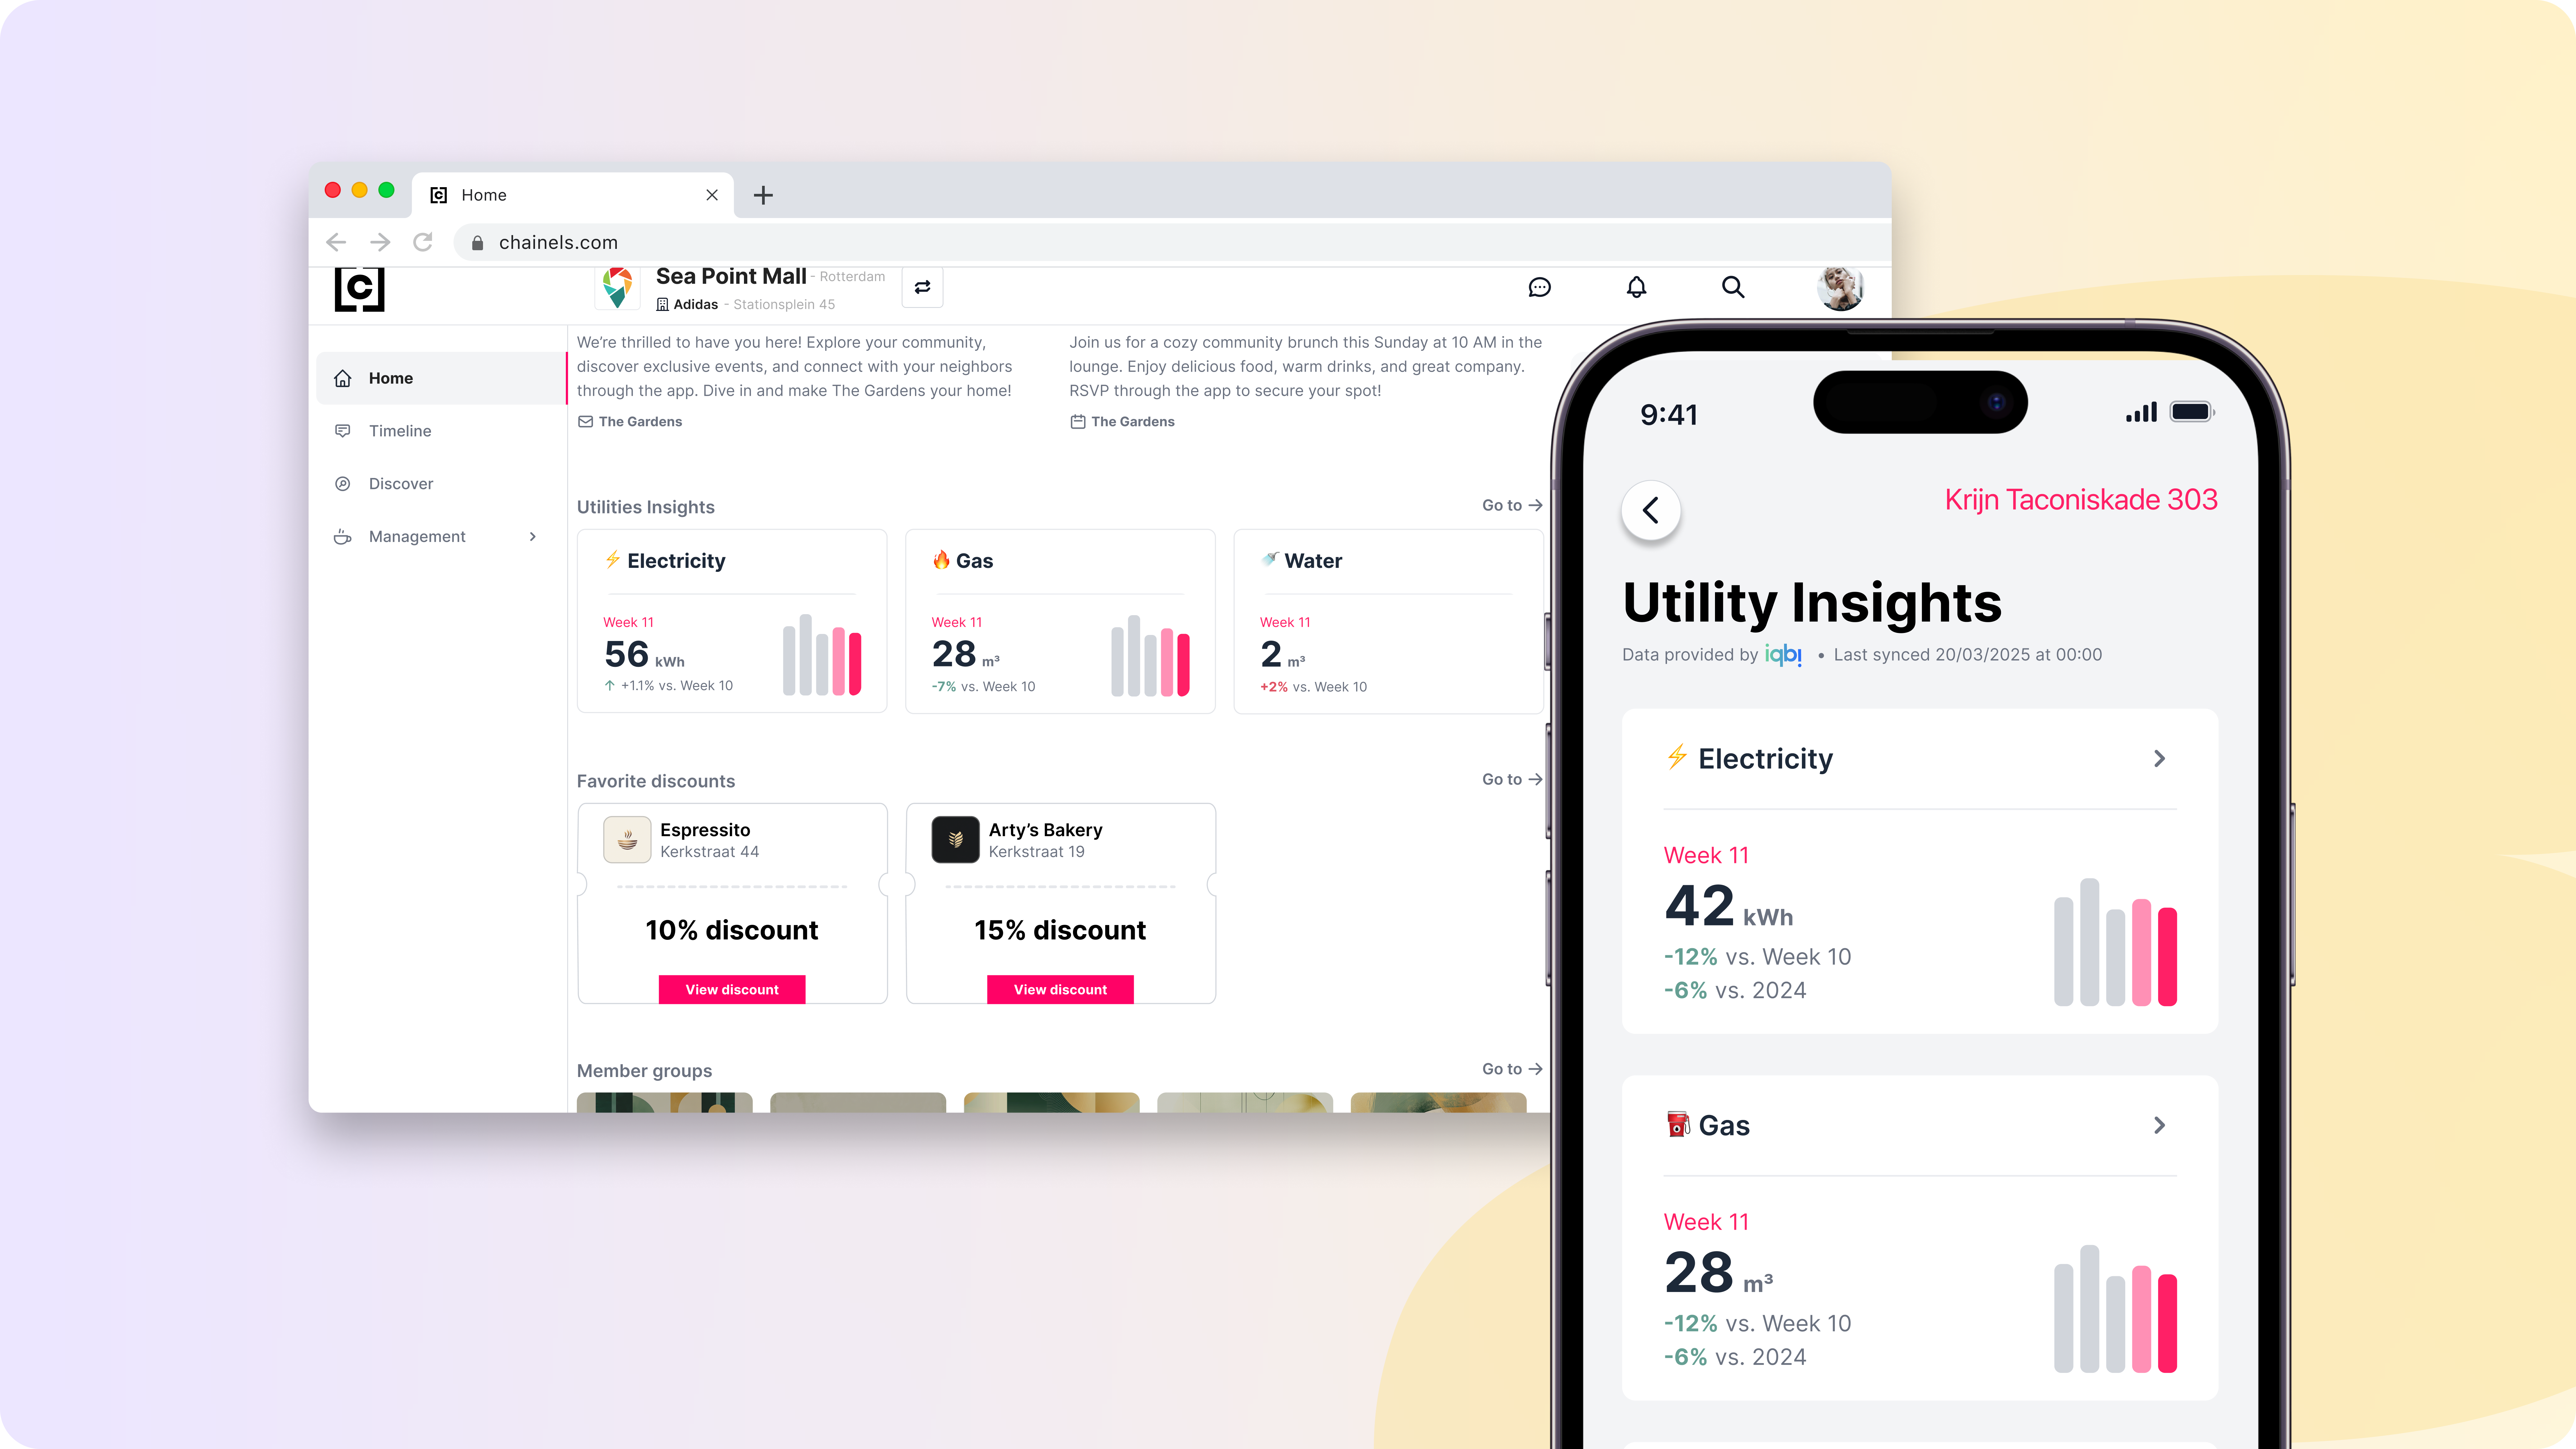
Making utilities data accessible for tenants
When tenants open their app, they will see a snapshot of their utilities usage with week over week comparisons and clear trend signals. Imagine a tenant opening the app on Monday and seeing that their electricity in one week is higher than in the previous week. This change is highlighted in red to indicate an increase. In the following week, after they consciously try to reduce their usage, they might see that their usage has dropped compared to the previous week, and that reduction appears in green as a positive signal. The point is not to overwhelm your tenants with complicated numbers, but to make it obvious to them when their behaviour is moving in the right or wrong direction.
![[BLOG Chainels] red and green percentages](https://getchainels.com/hs-fs/hubfs/%5BBLOG%20Chainels%5D%20red%20and%20green%20percentages.png?width=7680&height=4320&name=%5BBLOG%20Chainels%5D%20red%20and%20green%20percentages.png)
If historical data is available, tenants can view a more detailed graph. This graph shows their daily usage over the last seven days and compares the utilities of a particular day with the same day in the previous year. A tenant could look at a very cold week this year and see how the current year’s heating usage compares to last year’s.
![[BLOG Chainels] highlights-3](https://getchainels.com/hs-fs/hubfs/%5BBLOG%20Chainels%5D%20highlights-3.png?width=7680&height=4320&name=%5BBLOG%20Chainels%5D%20highlights-3.png)
This level of visibility is particularly powerful for sustainability minded tenants who care deeply about their environmental impact and want tangible feedback on their efforts to reduce their usage. It is important to note that privacy is prioritised. Tenants only see the readings for their own unit. They cannot view other tenants’ utilities, nor can they see data belonging to previous occupants.
Making utilities data actionable for teams
For your teams, the integration behind Utilities Insights unlocks two levels of data insights.
A manager can also see utilities usage for each unit with week over week comparisons and trends. This is especially helpful when tenants reach out with questions about their bills, about an unusual spike or about whether they can afford to keep the heating at a certain level during winter. Instead of spending time looking for this info, community managers can open the relevant tenant’s utilities view directly in Chainels and respond immediately.
The second level is an aggregated view of your building's entire utilities usage. Here, managers see total utilities across all units and shared areas. When overall usage is significantly higher than expected, this could be a signal of waste, inefficiency or a technical issue. Perhaps heating is left running overnight in common spaces, perhaps a pump or HVAC system is malfunctioning, or perhaps several tenants are using energy intensive devices more frequently.
The aggregated insights make it much easier to take action. For example, lets say electricity usage across your building has spiked, your team can share a message in the platform to remind tenants to pay attention to switching off lights when they aren’t using them or to close windows when heating is on.
Over time, your team can also see whether these nudges make a measurable difference. If a reminder message or a small campaign to reduce heating usage is followed by a drop in the community’s total usage, the impact of that communication is visible in the data.
![[BLOG Chainels] timeline message](https://getchainels.com/hs-fs/hubfs/%5BBLOG%20Chainels%5D%20timeline%20message.png?width=7680&height=4320&name=%5BBLOG%20Chainels%5D%20timeline%20message.png)
Utilities Insights therefore does more than simply make data insights accessible. It gives your teams a practical way to involve tenants in your strategy to lower operational costs and support ESG commitments.
Get started with utilities insights in your community
Utilities Insights closes a long standing gap between utilities data and tenant behaviour. It gives your tenants the visibility they need to act on their usage and gives your teams the clarity they need to guide strategies to lower utilities. As it becomes a shared resource that builds awareness, reduces waste and supports the long term sustainability of your building, we can imagine you're eager to get it for your community.
How to bring utilities insights to your community?
- Reach out to your account manager and share your interest
- Tell us which provider you work with so we can confirm if an integration is possible. If you use iqbi, kamstrup, rhino, or Utopi, you are in good hands, as we are already or have already worked on integrations with them.
- Once the integration is completed, the operations team will enable utilities insights in your community!